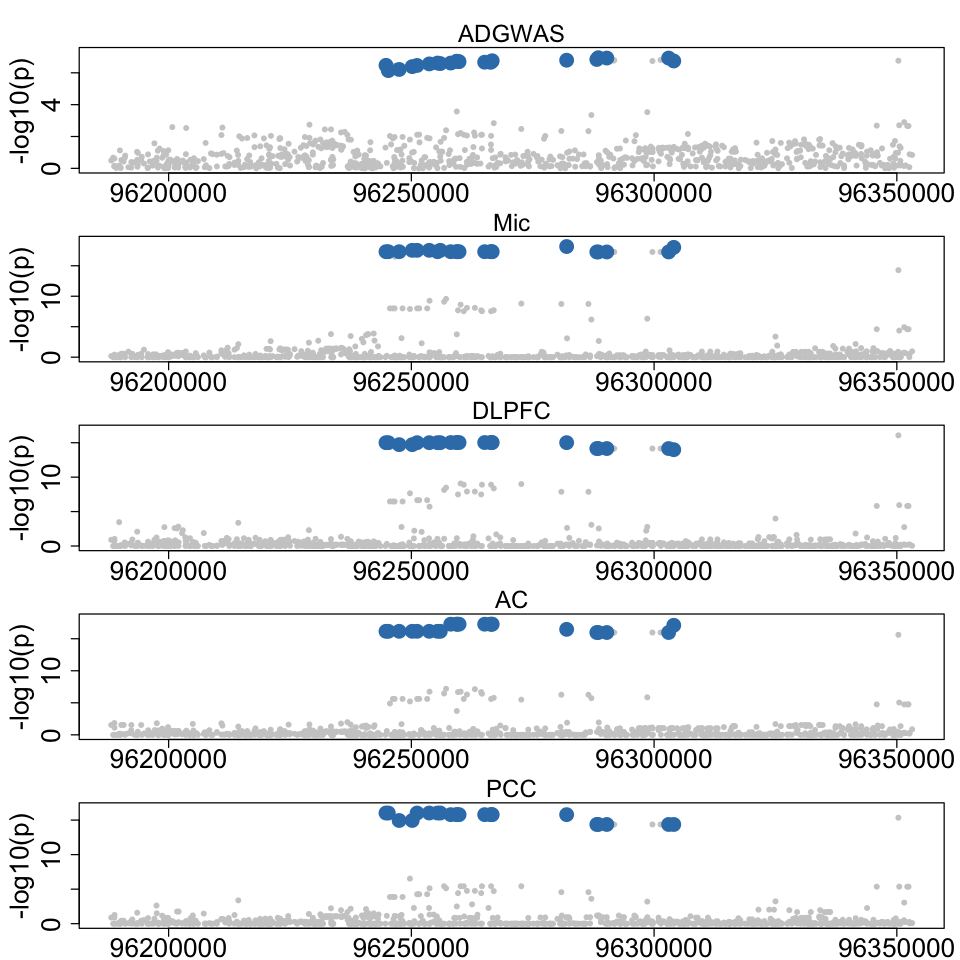
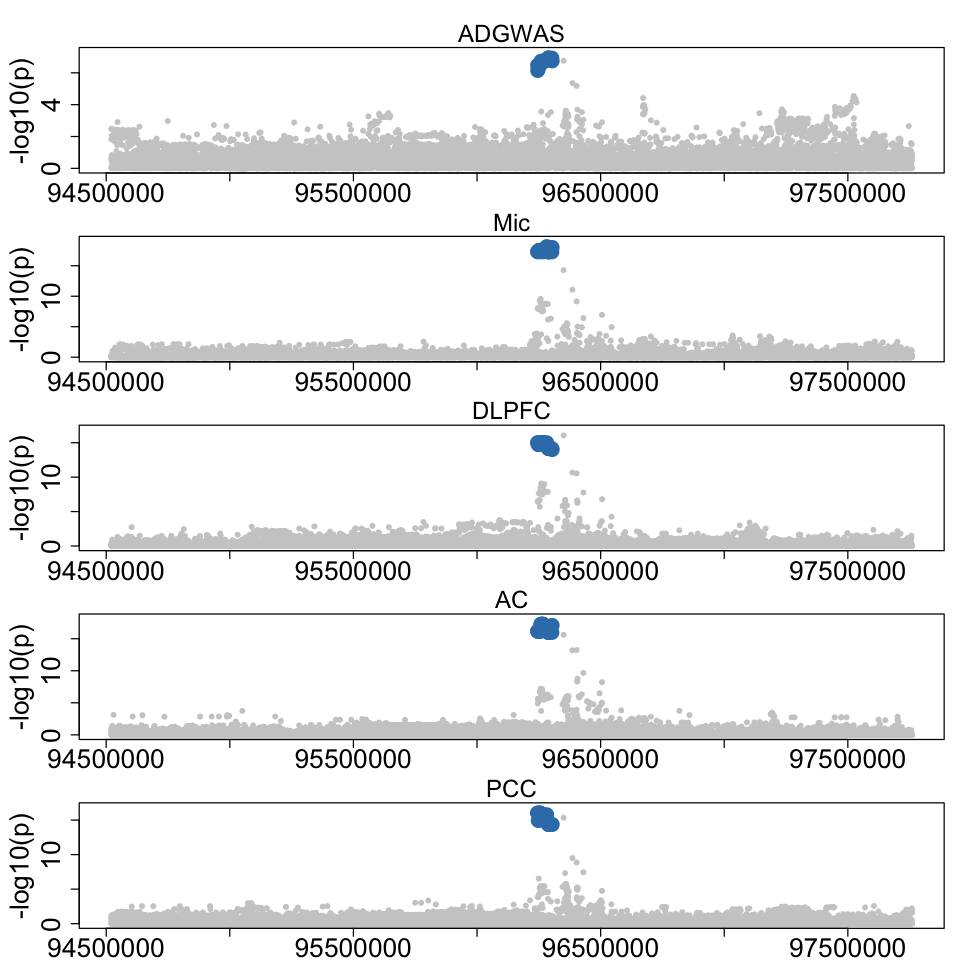
Figure 6g. Microglia-specific eQTL colocalization in BLNK.#
An example case of AD-xQTL colocalization demonstrating a single CoS with cell-type specific colocalization in microglia for BLNK gene.
res <- readRDS("data/Figure_6g_BLNK.rds")
options(repr.plot.width = 8, repr.plot.height = 8)
colocboost_plot(res, variant_coord = TRUE, plot_cols = 1, plot_cos_idx = 3)
res$cos_details$cos_outcomes_npc$`cos3:y1_y2_y3_y4_y12`
| outcomes_index | relative_logLR | npc_outcome | |
|---|---|---|---|
| <dbl> | <dbl> | <dbl> | |
| Mic | 1 | 2.846048 | 0.9966275 |
| AC | 3 | 2.777789 | 0.9961342 |
| PCC | 4 | 2.553701 | 0.9939482 |
| DLPFC | 2 | 2.027412 | 0.9826615 |
| ADGWAS | 12 | 1.393276 | 0.9383666 |
colocboost_plot(res, variant_coord = TRUE, pos = c(7941:8800), plot_cols = 1, plot_cos_idx = 3)