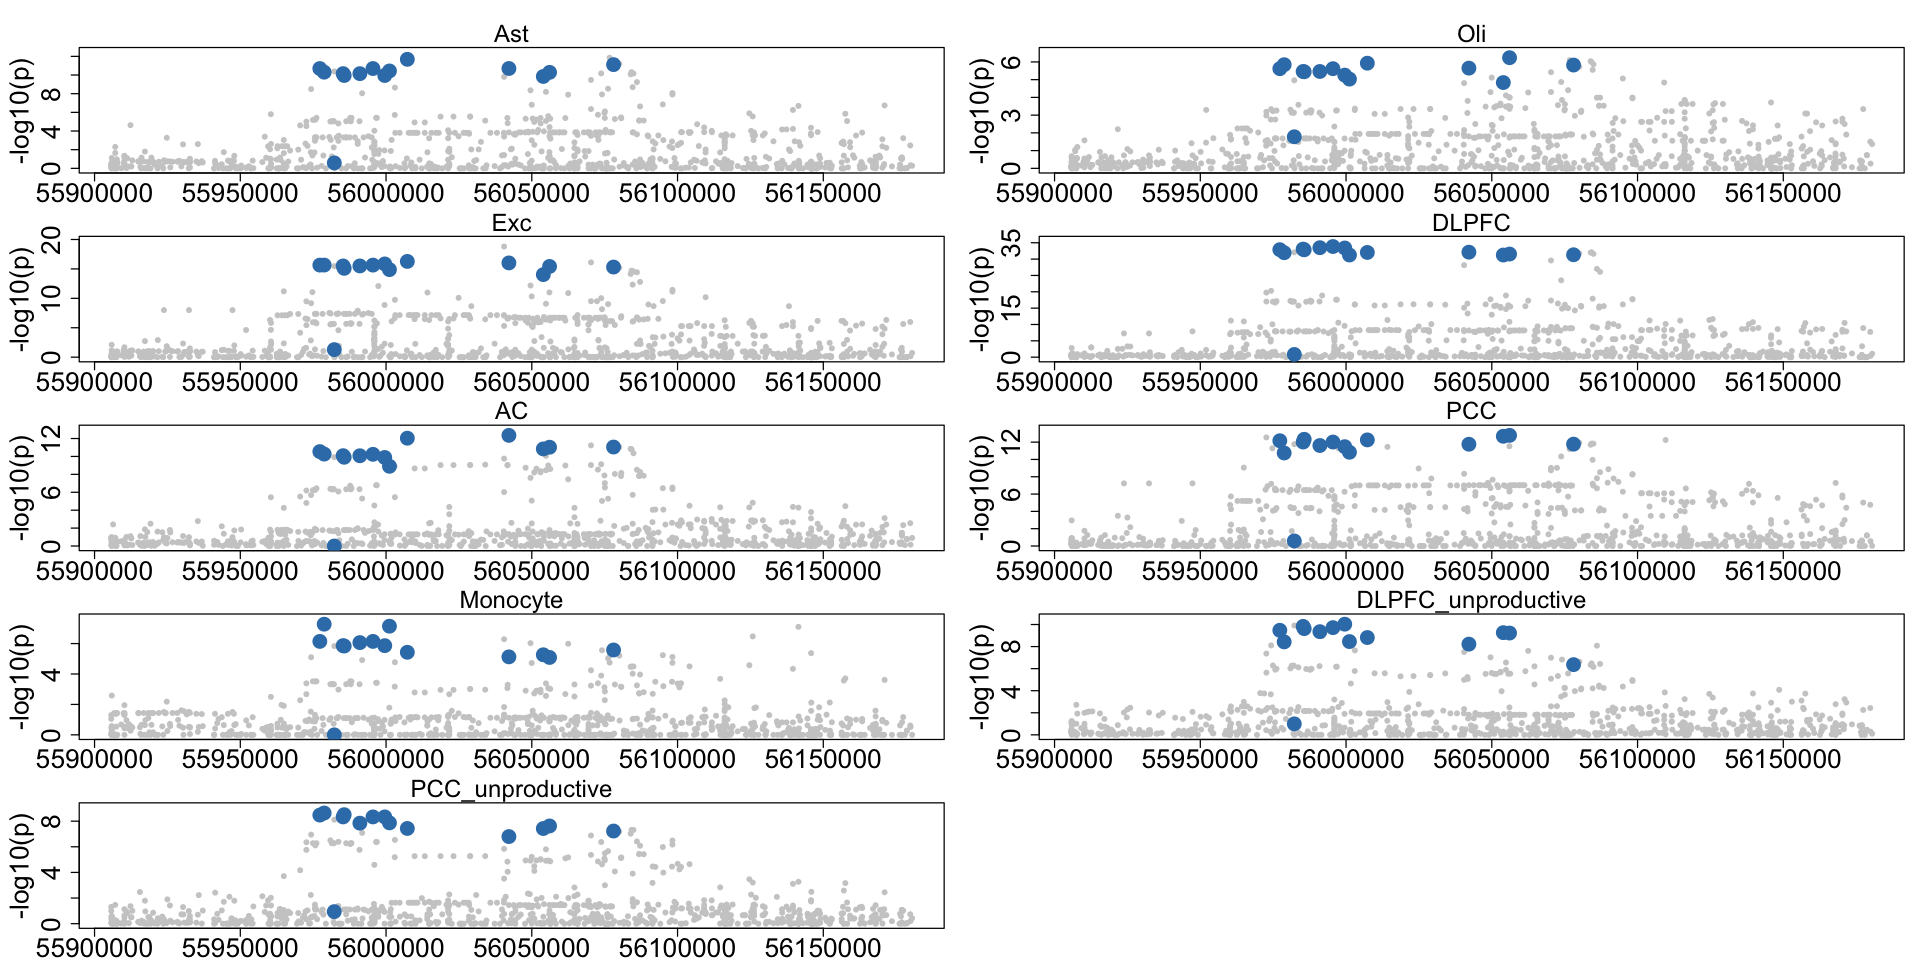
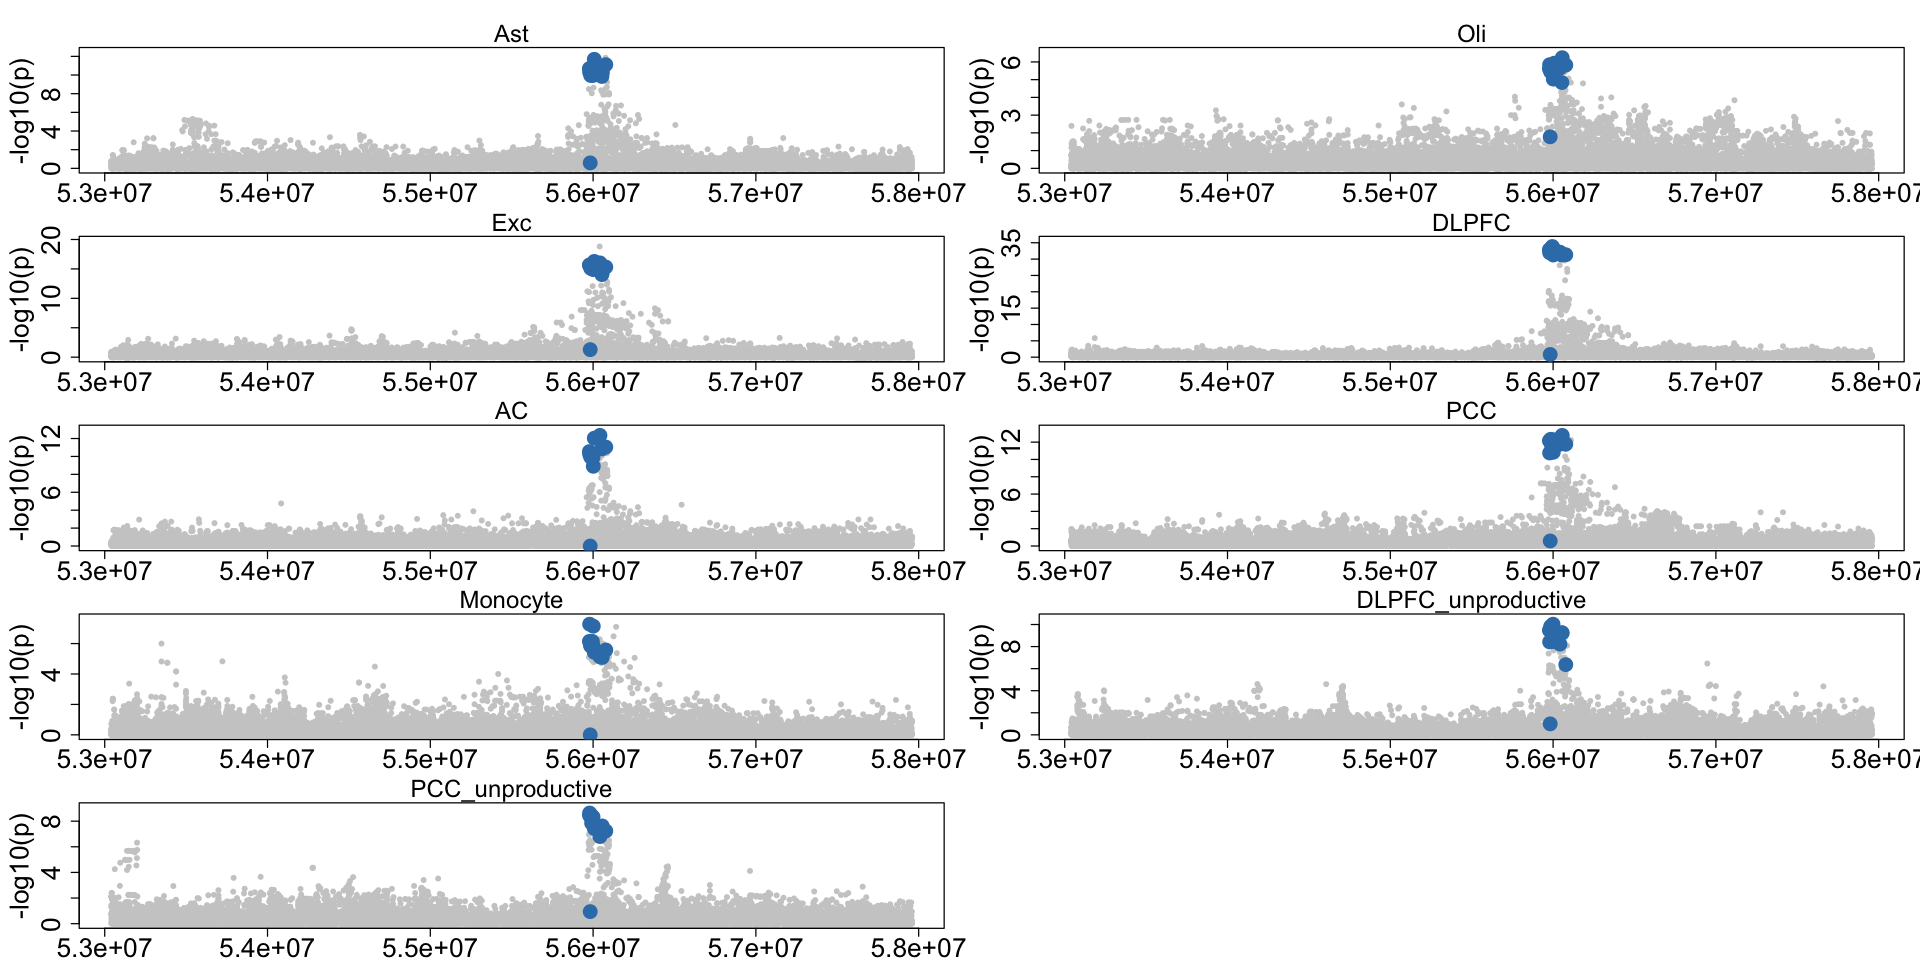
Figure 4d. Multiple xQTL colocalization in SUOX.#
A second CoS-gene link, reflecting colocalization between monocyte eQTLs and bulk brain region data at the SUOX gene, is similarly validated by CRISPRi in K562 cells.
res <- readRDS("data/Figure_4e_SUOX.rds")
options(repr.plot.width = 16, repr.plot.height = 8)
colocboost_plot(res, variant_coord = TRUE, plot_cols = 2, plot_cos_idx = 2)
res$cos_details$cos_outcomes_npc$`cos2:y1_y2_y3_y5_y6_y7_y8_y12_y13`
| outcomes_index | relative_logLR | npc_outcome | |
|---|---|---|---|
| <dbl> | <dbl> | <dbl> | |
| DLPFC | 5 | 5.1144218 | 0.9999639 |
| AC | 6 | 1.5218340 | 0.9523402 |
| PCC | 7 | 1.4118542 | 0.9406147 |
| DLPFC_unproductive | 12 | 1.2622277 | 0.9198981 |
| PCC_unproductive | 13 | 1.0512401 | 0.8778469 |
| Ast | 1 | 1.0129124 | 0.8681150 |
| Exc | 3 | 0.6721499 | 0.7392778 |
| Monocyte | 8 | 0.6213601 | 0.7114019 |
| Oli | 2 | 0.3750395 | 0.5276708 |
colocboost_plot(res, variant_coord = TRUE, pos = c(13600:14500), plot_cols = 2, plot_cos_idx = 2)