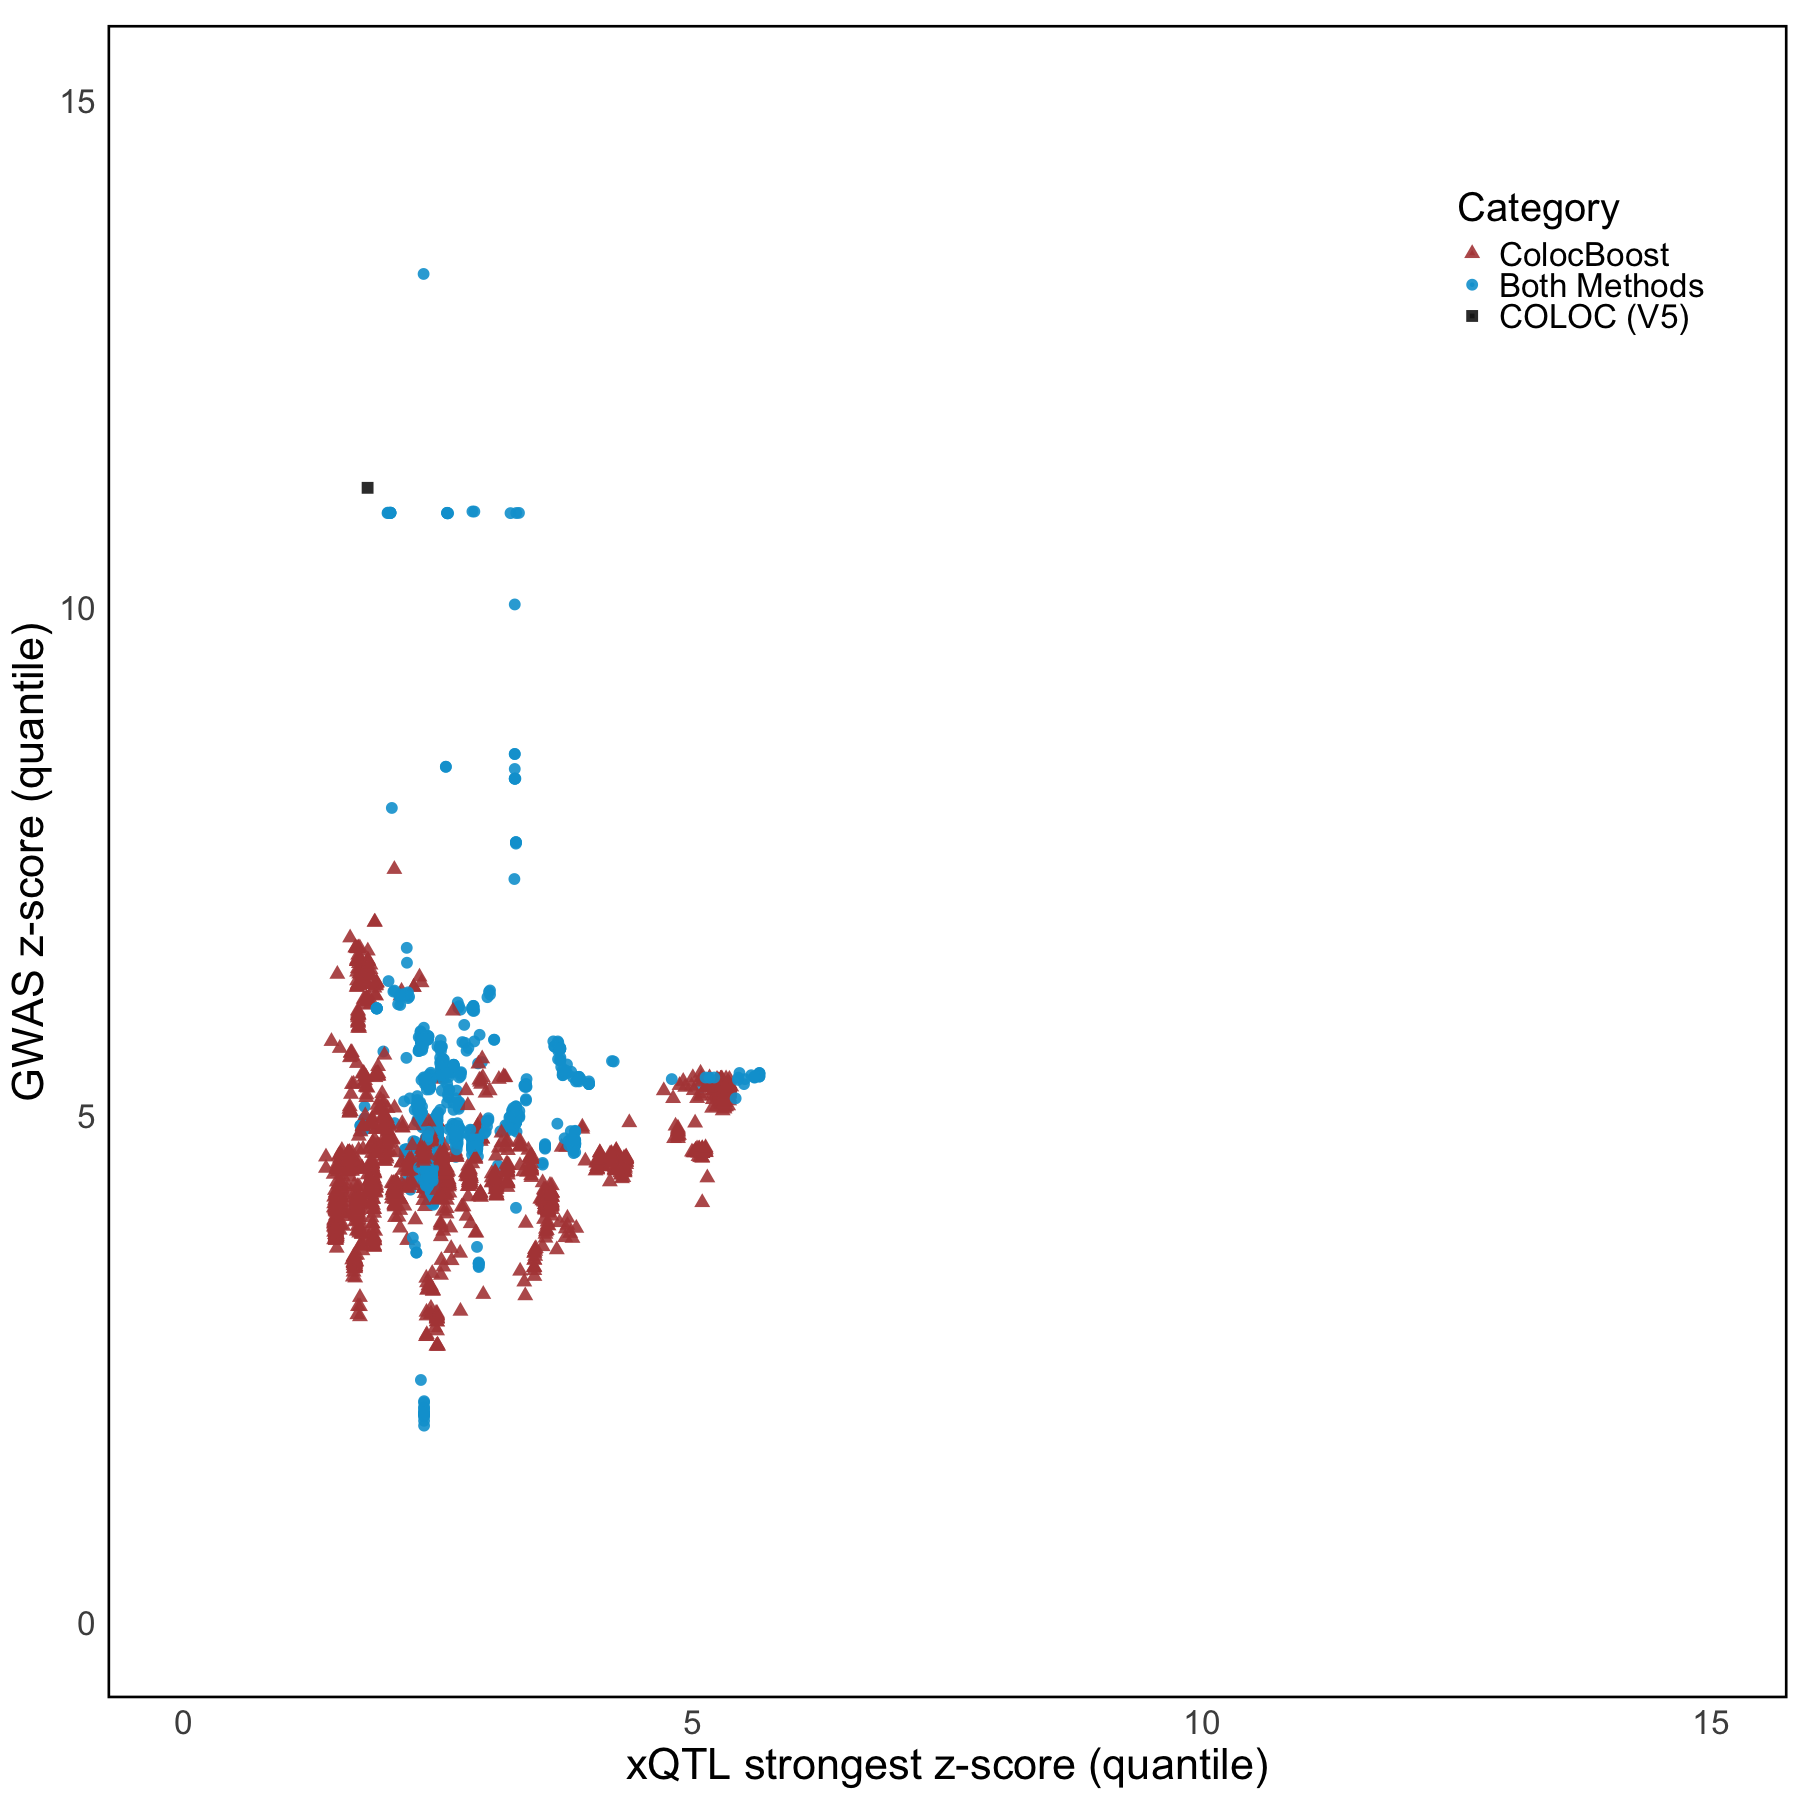
Figure 6b. Scatter plot across variants in terms of the magnitude of quantile-matched z-scores.#
Scatter plot across variants comparing the marginal association z-scores in AD GWAS against the quantile-matched z-scores corresponding to the strongest marginal association signals (in terms of the magnitude of z-scores) across all xQTL traits for each CoS. We color-code variants within CoS corresponding ColocBoost, COLOC-union and both methods.
Note: we only include the information for the colocalized variants in 95% CoS from both ColocBoost and COLOC for this reproducable purpose.
don <- readRDS("data/Figure_6b.rds")
library(ggplot2)
p1 <- ggplot(don, aes(x = sqrt(xQTL_Quantile), y = sqrt(GWAS_Quantile), color = COLOC, shape = COLOC)) +
  geom_point(data = subset(don, COLOC=="0"), alpha=0.9, size=1) +
  geom_point(data = subset(don, COLOC!="0"), aes(color=COLOC), alpha=0.9, size=3) +
  scale_shape_manual(values = c("COLOC (V5)" = 15, "ColocBoost" = 17, "Both Methods" = 16, "0" = 20)) +
  # guides(shape = "none") +
  scale_color_manual(values = c("ColocBoost" = "#B24745FF",
                                "Both Methods" = "#00A1D5FF",
                                "COLOC (V5)" = "grey10",
                                "0" = "grey80")) +
  # geom_hline(yintercept = sqrt(qchisq(5e-8, 1, lower.tail = FALSE)), linetype = "dashed", color = "red", linewidth = 1) +
  # geom_hline(yintercept = sqrt(qchisq(1e-5, 1, lower.tail = FALSE)), linetype = "dashed", color = "green", linewidth = 1) +
  theme_minimal(base_size = 15) +
  labs(
    title = "",
    x = "xQTL strongest z-score (quantile)",
    y = "GWAS z-score (quantile)",
    color = "Category",
    shape = "Category"
  ) +
  xlim(c(0, 15)) +
  ylim(c(0, 15)) +
  theme(
    plot.title = element_text(size = 0),
    axis.title.x = element_text(size = 26),
    axis.title.y = element_text(size = 26),
    axis.text.x = element_text(size = 20),
    axis.text.y = element_text(size = 20),
    legend.title = element_text(size = 24),
    legend.text = element_text(size = 20),
    legend.position = "inside",
    strip.text = element_text(size = 0, face = "bold"),
    legend.justification = c(0.95, 0.9),
    panel.grid.major = element_blank(),
    panel.grid.minor = element_blank(),
    panel.border = element_rect(color = "black", fill = NA, linewidth = 1.5)
  )
options(repr.plot.width = 15, repr.plot.height = 15)
p1