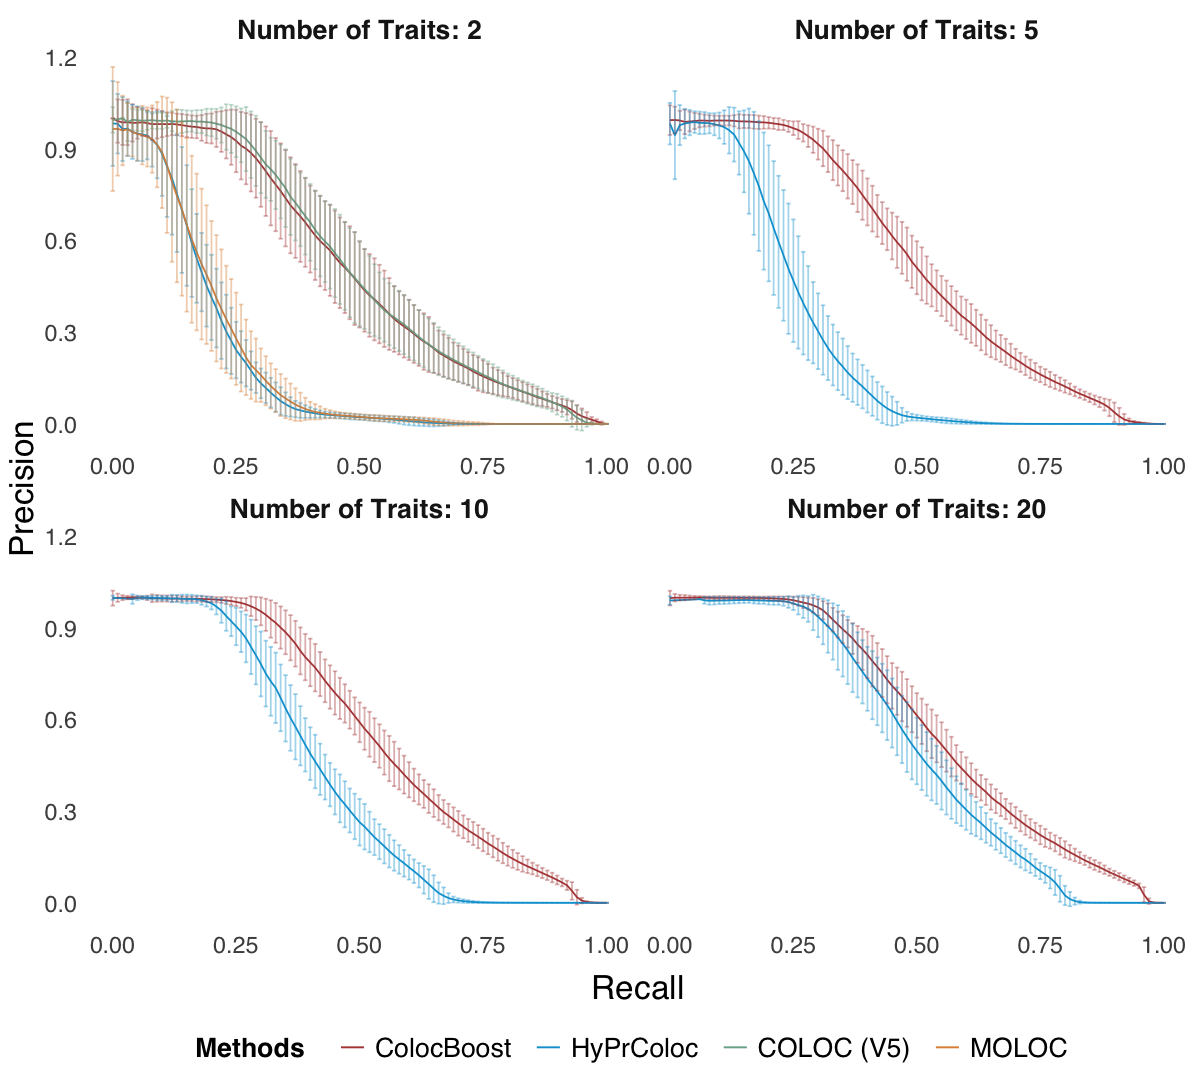
Figure 2c. Variant‐level precision‐recall curves.#
Variant‐level precision‐recall curves by varying the colocalization score threshold (ColocBoost uses VCP; COLOC/HyPrColoc use variant-level scores from their respective methods; Methods and Supplementary Note).
library(tidyverse)
library(ggpattern)
library(ggpubr)
library(cowplot)
res <- readRDS("data/Figure_2c.rds")
colors_man <- c("#B24745FF", "#00A1D5FF", "#79AF97FF", "#DF8F44FF")
plt = res %>%
  ggplot(aes(x = recall, y = mean, color = method)) +
  geom_line(linewidth= 0.5) +
  geom_errorbar(aes(ymin = mean - 1.96 * se,
                    ymax = mean + 1.96 * se), alpha = 0.4) +
  facet_wrap(.~ trait,
             labeller = labeller(trait = function(x) paste("Number of Traits:", x)), scales = "free_x", nrow = 2) +
  labs(x = "Recall", y = "Precision", color = "Methods")+
  theme_minimal()  +
  scale_color_manual(values = colors_man, name = "Methods")+
  theme(legend.position = "bottom",
        axis.title.x = element_text(margin = margin(t = 10), size = 20),
        axis.title.y = element_text(size = 20),
        axis.text.x = element_text(size = 14),
        axis.text.y = element_text(size = 14),
        strip.text = element_text(size = 16, face = "bold"),
        legend.title = element_text(size = 16, face = "bold", margin = margin(l = 0, r= 20)),  # Change legend title font size and style
        legend.text = element_text(size = 16, margin = margin(l = 5, r= 8)),
        text=element_text(size=16,  family="sans")) + theme(
          panel.grid.major = element_blank(),      # Remove major grid lines
          panel.grid.minor = element_blank(),      # Remove minor grid lines
        )
options(repr.plot.width = 10, repr.plot.height = 9)
plt