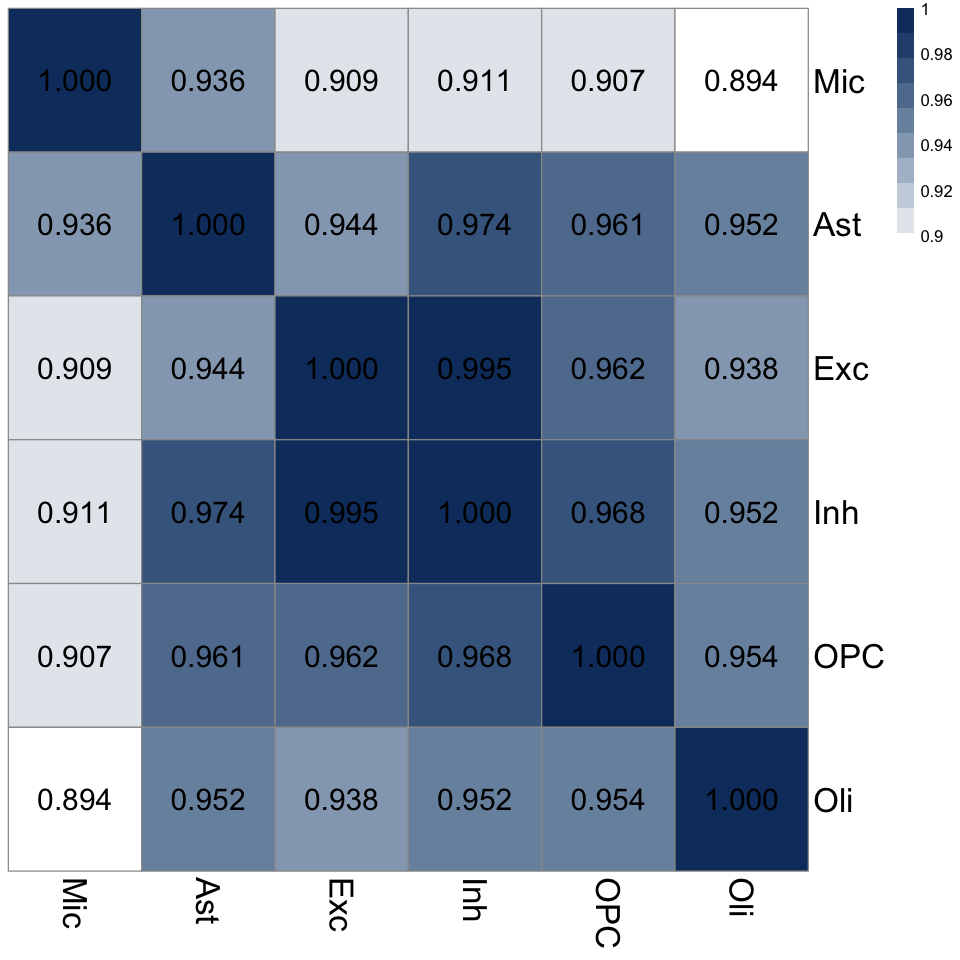
Figure 3f. Homogeneity in causal effect directions.#
For each pair of brain cell types, we assess the homogeneity in estimated causal effects directions by measuring the proportion of colocalized signals exhibiting concordant effect size signs.
homo_rate <- readRDS("data/Fig_3g_homo_rate.rds")
custom_colors <- colorRampPalette(c("white", "#0F3B6D"))(10)
formatted_numbers <- format(round(homo_rate, 3), nsmall = 3)
breaks <- seq(0.89, 1, length.out = 11)
options(repr.plot.width = 8, repr.plot.height = 8)
pheatmap::pheatmap(homo_rate, color = custom_colors, breaks = breaks,
                   cluster_cols = FALSE, cluster_rows = FALSE, display_numbers = formatted_numbers, fontsize_number = 18,
                   fontsize_row = 20,
                   fontsize_col = 20,
                   number_color = "black")