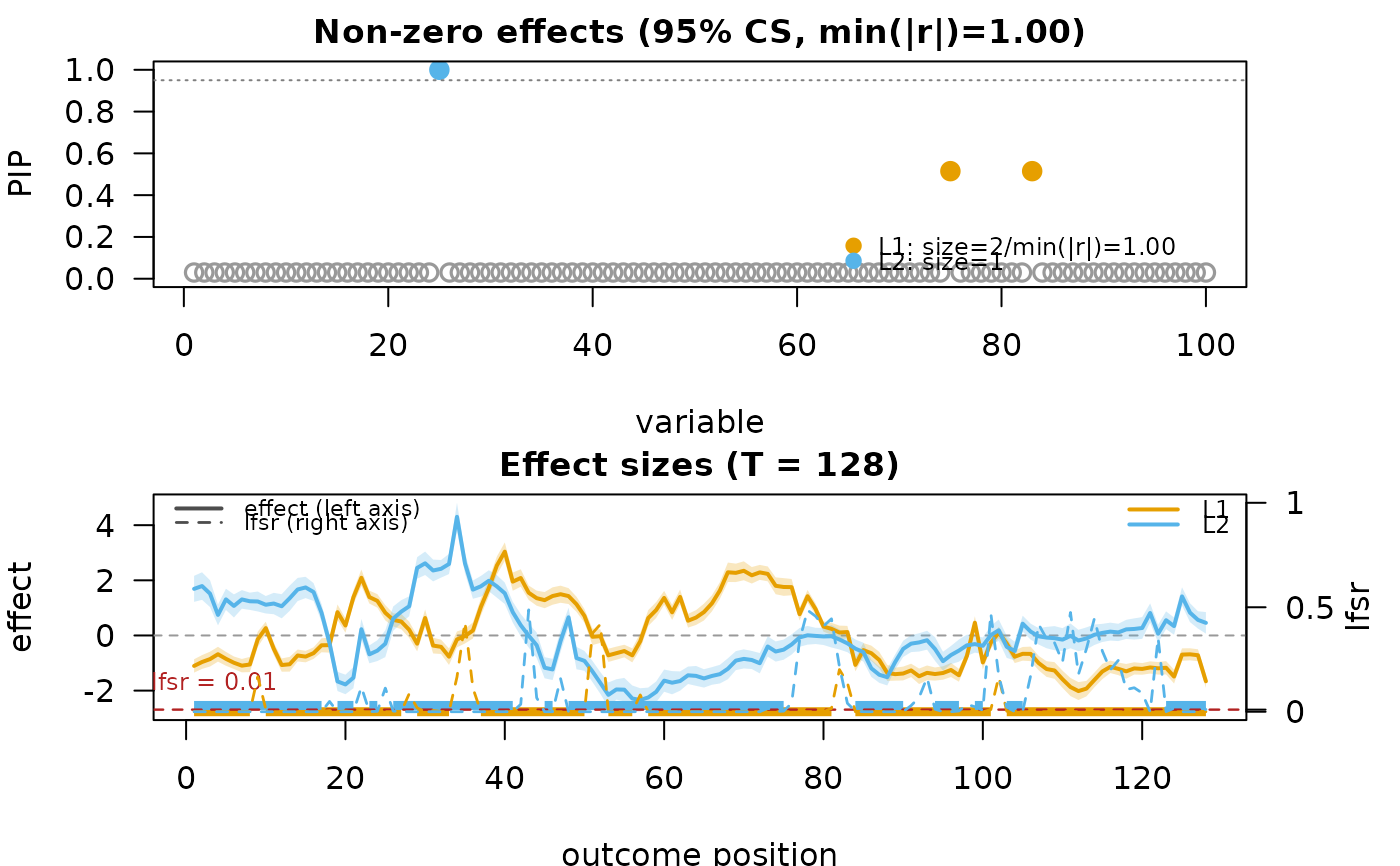
Simulated cis-QTL data on a power-of-two grid of positions:
n = 574 (the full susieR::N3finemapping$X[, 1:100] LD
scaffold), p = 100 SNPs, T = 128 evenly-spaced
positions. Two causal SNPs at positions 25 and 75 carry
smooth random per-position effects sampled from the IBSS
wavelet prior, matching the smooth-function class fSuSiE
assumes. The same shape applies to RNA-seq exon-body
coverage, ATAC-seq peak coverage, WGBS / ChIP-seq read
counts on a window, or any per-position coverage /
read-count assay. Used by vignette("fsusie_intro").
Format
A list with components
Xn x pgenotype matrix (n = 574,p = 100) sliced fromsusieR::N3finemapping$X[, 1:100].Yn x Tper-position response matrix (T = 128).poslength-
Tinteger vector of positions.causal_snpsinteger vector
c(25, 75)of column indices inXthat carry true effects.causal_betaslength(causal_snps) x Tmatrix of true per-position effects.descriptionfree-text description.
Examples
# \donttest{
data(coverage_example)
fit <- fsusie(coverage_example$Y, coverage_example$X,
              pos = coverage_example$pos,
              L = 15, L_greedy = 5, verbose = TRUE)
#> iter          ELBO       delta   sigma2      mem      V  extras
#>    1   -102564.3928           -   [0.998, 0.999, 1.000]   0.17 GB  [2.71e-02, 2.01e-02, 0 x 3]  pi_null=[0.56, 1.00]
#> iter   2: max|d(alpha,PIP)|=2.37e-12, V=[3.14e-02, 2.11e-02, 0 x 3] -- converged (alpha_pip_fixed_point) [mem: 0.17 GB]
#> [L_greedy] 1 round, greedy_lbf_cutoff=0.100, final L=5
#> round  L     min(lbf)   action
#> 1      5     0.000      saturated
fit_s <- mf_post_smooth(fit, method = "TI")
mfsusie_plot(fit_s)

# }
# }