Why does neutral variation disappear faster in a small population?
In a diploid population, an allele at frequency occupies some of the copies of a locus. Each generation draws a new set of copies. Even if the allele has no fitness effect, its frequency changes by chance.
The essential distinction is between the mean frequency across many populations and the variation among those populations. Neutral drift leaves the mean unchanged but spreads the frequencies apart. At the boundaries, an allele is either lost or fixed.
A small model
Let be the number of copies of the allele in the next generation. The Wright–Fisher model says
Thus , while . The same sampling step produces larger fluctuations when is smaller.
For two randomly drawn copies, expected heterozygosity is . Without mutation or migration, its mean across populations falls by a factor each generation. We should see nearly the same mean allele frequency in small and large populations, but a faster loss of diversity in small populations.
Follow the same allele in many populations
Each column below is an independent population that starts at . The only difference is population size.
simulate_drift <- function(n_diploid, n_pop, generations, p0) {
  frequency <- matrix(NA_real_, nrow = generations + 1, ncol = n_pop)
  frequency[1, ] <- p0
  for (t in seq_len(generations)) {
    frequency[t + 1, ] <- rbinom(
      n_pop, size = 2 * n_diploid, prob = frequency[t, ]
    ) / (2 * n_diploid)
  }
  frequency
}

set.seed(8149)
p0 <- 0.5
generations <- 60
small <- simulate_drift(n_diploid = 20, n_pop = 300, generations, p0)
large <- simulate_drift(n_diploid = 200, n_pop = 300, generations, p0)
stopifnot(all(small >= 0 & small <= 1), all(large >= 0 & large <= 1))
The thin lines show individual small populations. The right panel averages heterozygosity across all 300 populations of each size. The dashed curves are the model’s prediction, not a fit to the simulations.
time <- 0:generations
mean_h <- function(frequency) rowMeans(2 * frequency * (1 - frequency))
predicted_h <- function(n_diploid) {
  2 * p0 * (1 - p0) * (1 - 1 / (2 * n_diploid))^time
}

old_par <- par(mfrow = c(1, 2), mar = c(4, 4, 2, 1), bg = "white")
matplot(time, small[, 1:15], type = "l", lty = 1, col = "grey65",
        xlab = "Generation", ylab = "Allele frequency", ylim = c(0, 1))
abline(h = p0, col = "black", lty = 2)
plot(time, mean_h(small), type = "l", lwd = 2, col = "#B44A3A",
     xlab = "Generation", ylab = "Mean heterozygosity", ylim = c(0, 0.52))
lines(time, predicted_h(20), col = "#B44A3A", lty = 2, lwd = 2)
lines(time, mean_h(large), col = "#306C9A", lwd = 2)
lines(time, predicted_h(200), col = "#306C9A", lty = 2, lwd = 2)
legend("topright", c("N = 20", "N = 200", "Model expectation"),
       col = c("#B44A3A", "#306C9A", "black"), lty = c(1, 1, 2),
       bty = "n", cex = 0.8)
par(old_par)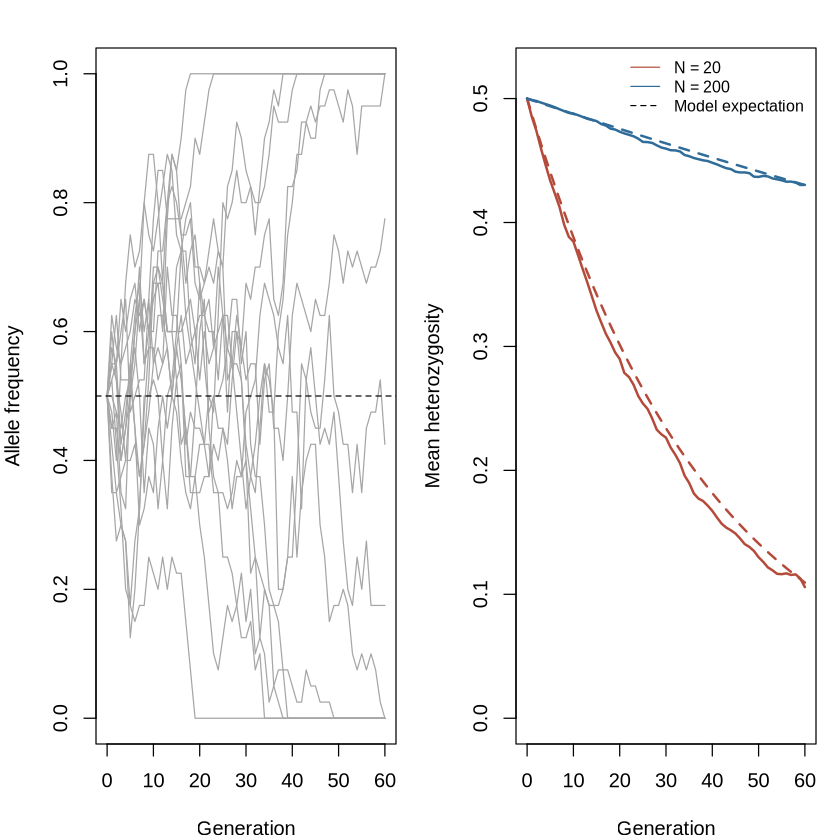
The mean allele frequency can stay near 0.5 even after many individual populations have moved far from it. Heterozygosity tells us what happens within a population; the mean frequency alone does not.
The exact decline factor also provides a check on the code. Sampling variation means that 300 simulated populations need not land exactly on the dashed curves.
data.frame(
  population = c("N = 20", "N = 200"),
  mean_frequency = round(c(mean(small[61, ]), mean(large[61, ])), 3),
  mean_heterozygosity = round(c(mean_h(small)[61], mean_h(large)[61]), 3),
  model_heterozygosity = round(c(predicted_h(20)[61], predicted_h(200)[61]), 3)
)What to remember
Finite sampling changes neutral allele frequencies. Smaller makes each step noisier, so diversity is lost faster. This is the forward-time view of drift; looking backward at sampled copies leads to coalescence.
Sources. Pritchard, An Owner’s Guide to the Human Genome, Section 2.1, especially Fig. 2.9; Gorroochurn, Population Genetics Notes, Sections 8.2–8.5. The simulation here is a small original illustration of their Wright–Fisher model (seed 8149; or 200; 300 populations; 60 generations). It is not a transcription of book code.