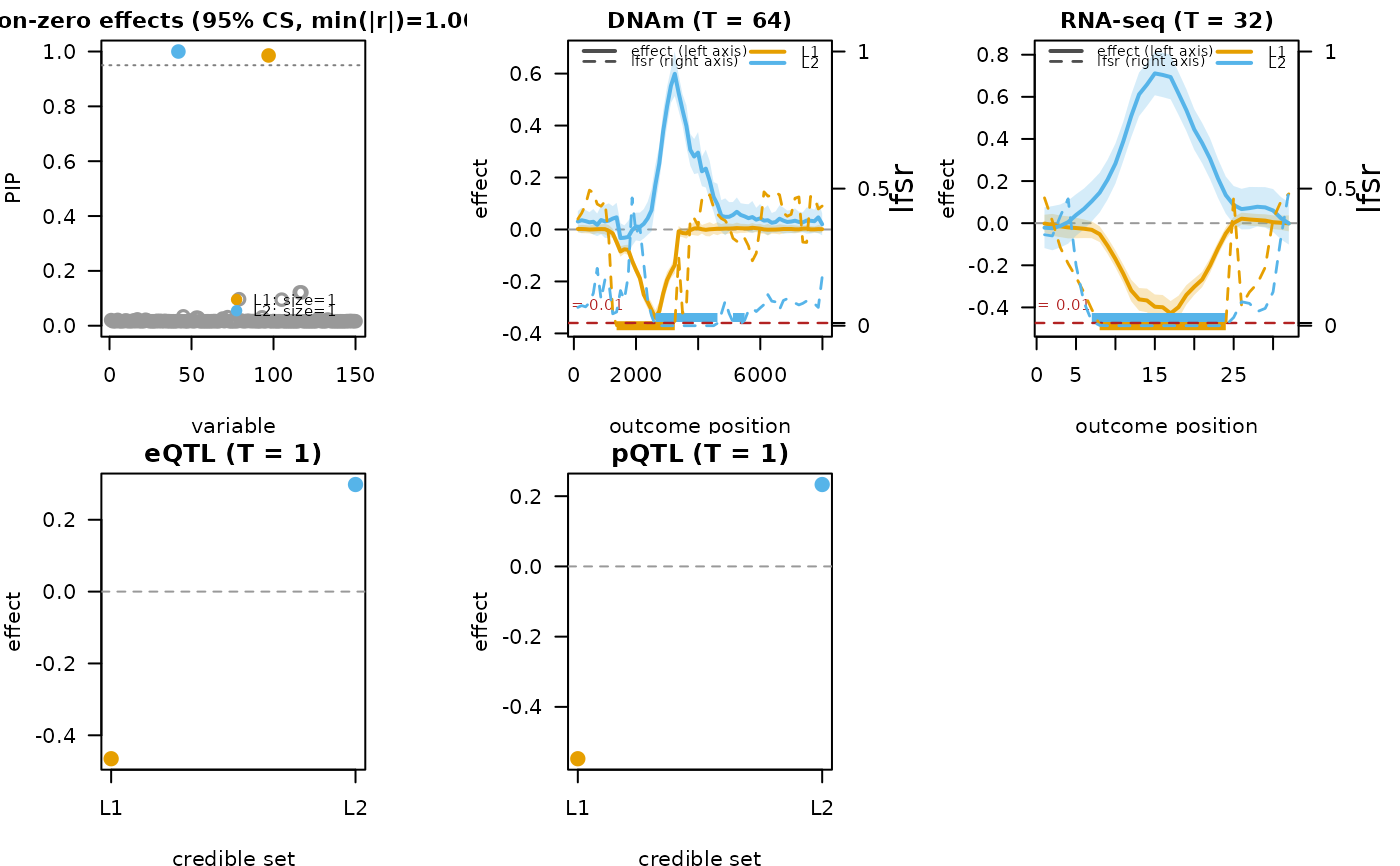
Simulated multi-outcome QTL data for mfsusie() covering
DNA methylation (functional, T = 64), RNA-seq (functional,
T = 32), and two scalar QTLs (eQTL, pQTL). Two causal SNPs
shared across all four outcomes; per-outcome shapes and
signs differ.
Format
A list with components
Xn x pgenotype matrix (p = 150) sliced fromsusieR::N3finemapping$X.Y_listnamed list of four outcomes:
dnam(n x 64),rna(n x 32),eqtl(n x 1),pqtl(n x 1).pos_listnamed list of position vectors (CpG bp, exon-body indices, scalar dummy
1Lfor the QTLs).causal_snpsinteger vector of shared causal SNPs.
descriptionfree-text description.
Examples
# \donttest{
data(multiomic_example)
fit <- mfsusie(multiomic_example$X, multiomic_example$Y_list,
               pos = multiomic_example$pos_list, L = 15, L_greedy = 5,
               verbose = TRUE)
#> HINT: ncol(Y) is not 2^J or positions are unevenly spaced; interpolated to a regular dyadic grid.
#> iter          ELBO       delta   sigma2      mem      V  extras
#>    1   -78782.8417           -   [0.998, 0.999, 1.000]   0.19 GB  [9.62e-02, 3.48e-02, 0 x 3]  pi_null=[0.17, 1.00]
#> Warning: Failed to converge within iterations limit. If "maxiter.sqp" is small,
#> consider increasing it. Otherwise, convergence failure is typically a
#> numerical issue remedied by increasing "eps" slightly, at the cost of
#> slightly less accurate solution; see help(mixsqp). An issue report may
#> also be submitted to https://github.com/stephenslab/mixsqp/issues,
#> accompanied by an .rds or .RData file containing the mixsqp inputs. If
#> these inputs are not accessible, an .RData file containing the inputs
#> can be generated by setting options(mixsqp.debug.mode = TRUE) before
#> running mixsqp.
#> HINT: mixsqp prior-update did not converge (status: "exceeded maximum number of iterations"). If this repeats, pass `control_mixsqp = list(numiter.em = 20, convtol.sqp = 1e-8, tol.svd = 1e-10)` to mfsusie() / fsusie() to use mixsqp's stock control.
#> iter   2: max|d(alpha,PIP)|=8.46e-02, V=[1.25e-01, 4.92e-02, 1.26e-03, 0 x 2] [mem: 0.19 GB]
#> iter   3: max|d(alpha,PIP)|=1.48e-01, V=[1.25e-01, 3.49e-02, 1.58e-03, 0 x 2] [mem: 0.19 GB]
#> iter   4: max|d(alpha,PIP)|=1.95e-01, V=[1.25e-01, 3.49e-02, 3.37e-03, 0 x 2] [mem: 0.19 GB]
#> iter   5: max|d(alpha,PIP)|=2.14e-01, V=[1.25e-01, 3.49e-02, 3.47e-03, 0 x 2] [mem: 0.19 GB]
#> iter   6: max|d(alpha,PIP)|=2.19e-01, V=[1.25e-01, 3.49e-02, 3.50e-03, 0 x 2] [mem: 0.19 GB]
#> iter   7: max|d(alpha,PIP)|=1.35e-01, V=[1.25e-01, 3.49e-02, 3.51e-03, 0 x 2] [mem: 0.19 GB]
#> iter   8: max|d(alpha,PIP)|=7.16e-02, V=[1.25e-01, 3.49e-02, 3.52e-03, 0 x 2] [mem: 0.19 GB]
#> iter   9: max|d(alpha,PIP)|=2.83e-02, V=[1.25e-01, 3.49e-02, 3.52e-03, 0 x 2] [mem: 0.19 GB]
#> iter  10: max|d(alpha,PIP)|=9.27e-05, V=[1.25e-01, 3.49e-02, 3.52e-03, 0 x 2] -- converged (alpha_pip_fixed_point) [mem: 0.19 GB]
#> [L_greedy] 1 round, greedy_lbf_cutoff=0.100, final L=5
#> round  L     min(lbf)   action
#> 1      5     0.000      saturated
fit_s <- mf_post_smooth(fit, method = "TI")
#> HINT: method = 'TI' is a wavelet smoother and adds no power for outcome 3 (T_m = 1, scalar). Falling back to method = 'scalewise' for that outcome.
#> HINT: method = 'TI' is a wavelet smoother and adds no power for outcome 4 (T_m = 1, scalar). Falling back to method = 'scalewise' for that outcome.
mfsusie_plot(fit_s)

# }
# }