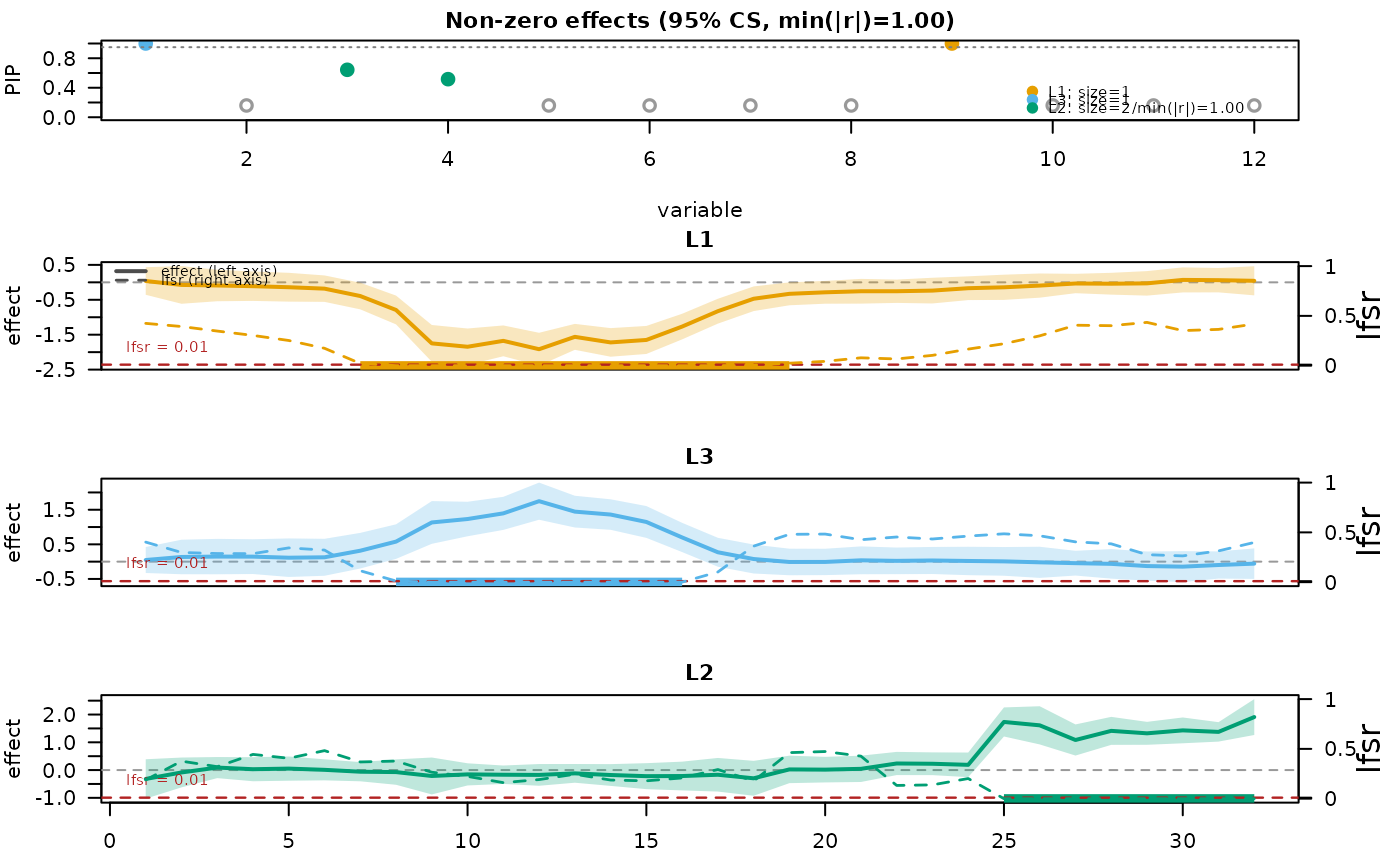
Simulated cis-mQTL data with n = 100 samples, p = 12
SNPs, and T = 32 CpGs. Three causal SNPs (1, 9, 3) act on
two CpG clusters: SNPs 1 and 9 affect cluster A (CpGs 9 to
16) with opposite signs, and SNP 3 affects cluster B (CpGs
25 to 32). SNP 4 is a high-LD near-clone of SNP 3.
Format
A list with components
Xn x pgenotype matrix (p = 12).Yn x Tmethylation matrix (T = 32).poslength-
Tinteger vector of CpG indices.causal_snpsinteger vector
c(1, 9, 3)of column indices inXthat carry true effects.causal_betaslength(causal_snps) x Tmatrix of true per-CpG effects.truth_masklength-3 list of length-
Tboolean vectors, one per CS, marking the CpGs each CS truly affects. Read bymfsusie_plot_lfsr()when thetruthargument is supplied.descriptionfree-text description of the dataset.
Examples
# \donttest{
data(dnam_example)
fit <- fsusie(dnam_example$Y, dnam_example$X,
              pos = dnam_example$pos, L = 15, L_greedy = 5, verbose = TRUE)
#> iter          ELBO       delta   sigma2      mem      V  extras
#>    1    -4486.6571           -   [0.991, 0.994, 1.000]   0.17 GB  [2.39e-02, 1.62e-02, 1.34e-02, 0 x 2]  pi_null=[0.35, 1.00]
#> iter   2: max|d(alpha,PIP)|=9.26e-02, V=[2.96e-02, 2.42e-02, 2.02e-02, 0 x 2] [mem: 0.17 GB]
#> iter   3: max|d(alpha,PIP)|=9.26e-02, V=[3.27e-02, 2.43e-02, 2.04e-02, 0 x 2] [mem: 0.17 GB]
#> iter   4: max|d(alpha,PIP)|=9.26e-02, V=[3.31e-02, 2.43e-02, 2.04e-02, 0 x 2] [mem: 0.17 GB]
#> iter   5: max|d(alpha,PIP)|=1.74e-05, V=[3.31e-02, 2.43e-02, 2.04e-02, 0 x 2] -- converged (alpha_pip_fixed_point) [mem: 0.17 GB]
#> [L_greedy] 1 round, greedy_lbf_cutoff=0.100, final L=5
#> round  L     min(lbf)   action
#> 1      5     0.000      saturated
fit_s <- mf_post_smooth(fit, method = "TI")
mfsusie_plot(fit_s)

# }
# }