Simulating Sparse Phenotypes
Alex McCreight
2026-02-17
Source:vignettes/sparse_phenotype_simulation.Rmd
sparse_phenotype_simulation.RmdThis vignette demonstrates how to use the
simulate_phenotype() function to simulate a sparse
architecture, with control over:
- The number of causal variants
- Per-SNP heritability
- Whether causal variants should be in low linkage disequilibrium (LD) with each other
Simulate Phenotype
Now we use simulate_phenotype() to generate a phenotype
with 3 independent causal variants, each explaining 5% of phenotypic
variance:
result <- simulate_phenotype(
  X = G,
  n_causal = 3,
  h2_per_snp = 0.05,
  independent = TRUE
)
Key parameters:
-
n_causal: Number of causal variants to simulate -
h2_per_snp: Heritability contributed by each causal SNP (total h2 = n_causal * h2_per_snp) -
independent: IfTRUE, causal SNPs are constrained to have low LD (|r| < 0.15) with each other
Examine Output
The function returns a list with all simulation components:
# Output structure
names(result)
# [1] "G" "y" "beta"
# [4] "causal" "h2_total" "h2_per_snp"
# [7] "residual_variance"
# Phenotype vector
head(result$y)
# [1] -4.7634051 -0.1104029 5.5577233 -14.4453739 -2.8296897 -5.1891438
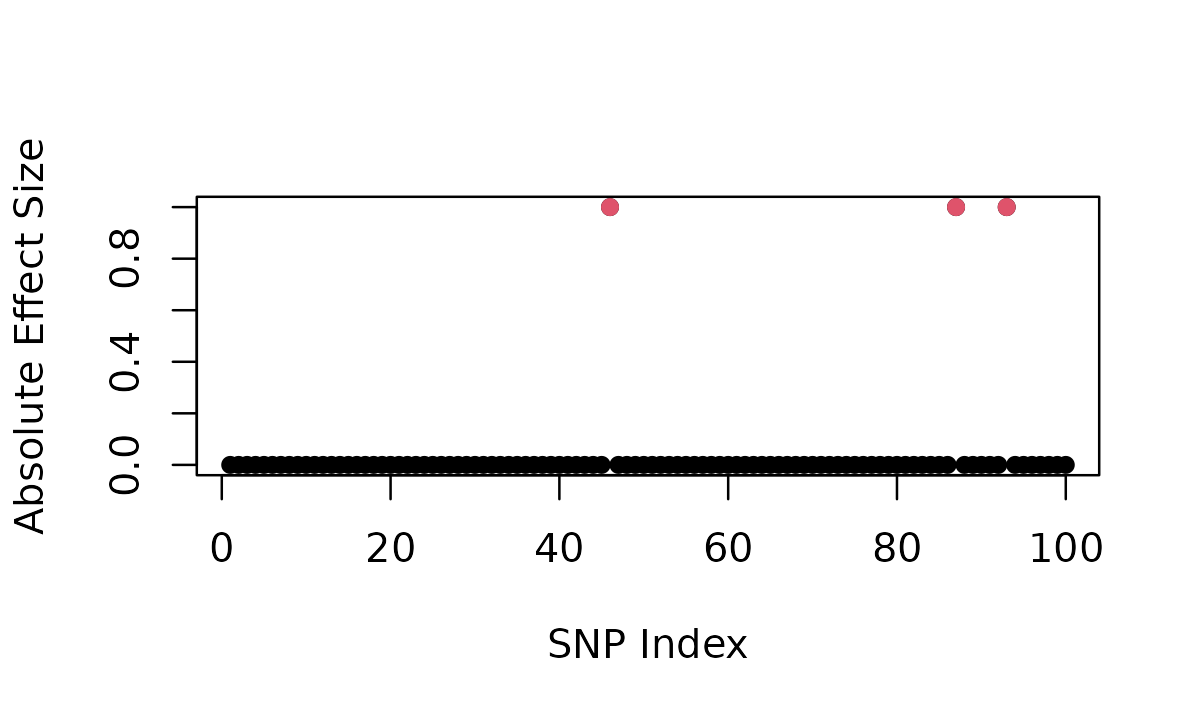
# Indices of causal variants
result$causal
# [1] 93 87 46
# Effect sizes (non-zero for causal variants)
result$beta[result$causal]
# [1] 1 1 1
# Heritability
cat("Total heritability:", result$h2_total, "\n")
# Total heritability: 0.15
cat("Per-SNP heritability:", result$h2_per_snp, "\n")
# Per-SNP heritability: 0.05